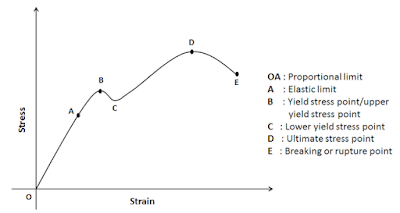
Very useful information concerning the behaviour of material for engineering applications can be obtained by making a tension test and plotting a curve showing the variation of stress with respect to strain. Therefore, the results of tension test are expressed by means of this curve. A stress-strain diagram for ductile material like mild steel is shown in the figure below.
Proportional Limit :
It is observed from the diagram that the stress strain relationship is linear from the point O to A. After A curve begins to deviate from the straight line.
Hooke's law states that stress is directly proportional to strain.
The term proportional limit is defined as the stress at which the stress-strain curve begins to deviate from the stress line so point A indicates the proportional limit.
Modulus of Elasticity :
Modulus of elasticity is the ratio of stress to strain up to point P.
It is given by the slope of the line OP
E = tanƟ = AP/OP = Stress / Strain
Where,
Stress = Vertical line perpendicular to point A on the X-axis point named P = AP
Strain = Horizontal distance from O to P = OP
Elastic Limit :
When the specimen is stressed beyond point A and up-to point B. It will regain its initial size and shape when the load is removed. This indicates that the material is an elastic stage up to the point E. So the E is called the elastic limit.
The Elastic Limit of the material is defined as the maximum stress without any permanent deformation.
Proportional limit and Elastic limit are very close to each other.
Yield Strength :
When the specimen is stress beyond point B, plastic deformation occurs and the material starts yielding. It is seen from the diagram that beyond point B, the strain increases at a faster rate up to a certain point then a small reduction in load and the curve drops down point C. So B is called upper yield stress point and C is called lower yield stress point.
The Yield Strength is defined as the maximum stress at which a marked increase in elongation occurs without an increase in the load.
Ultimate Tensile Strength :
After the point C plastic deformation of the specimen increases. The material becomes stronger due to strain hardening, and higher and higher load required to deform the material. Finally, the load increase so stress reach a maximum value, as given by the point D. The stress corresponding to the point D is called ultimate stress point.
The Ultimate Tensile Strength is the maximum stress that can be reached in the tension test.
Breaking or Rupture point :
For ductile material, the diameter of the specimen begins to decrease rapidly beyond the ultimate stress point D. There is a start reduction in cross-sectional area is called necking.
As the tensile stress progress and load increases the fracture takes place. This is shown by point E. So E is called breaking or rupture point.
Therefore, ultimate tensile strength is considered as failure criterion in brittle materials.
